

ODSC's goal is to bring together the global data science community in an effort to encourage the exchange of innovative ideas and the growth of open source software.
Background
Since 2014, ODSC grew from one small Boston event to a Global Brand holding events for up to 5000 data inclined professionals at a time. During my time at ODSC, we launched a webinar service, a podcast, a learning platform and a career platform on top of a growing in-person event offering.
Experience Design Research (XD)
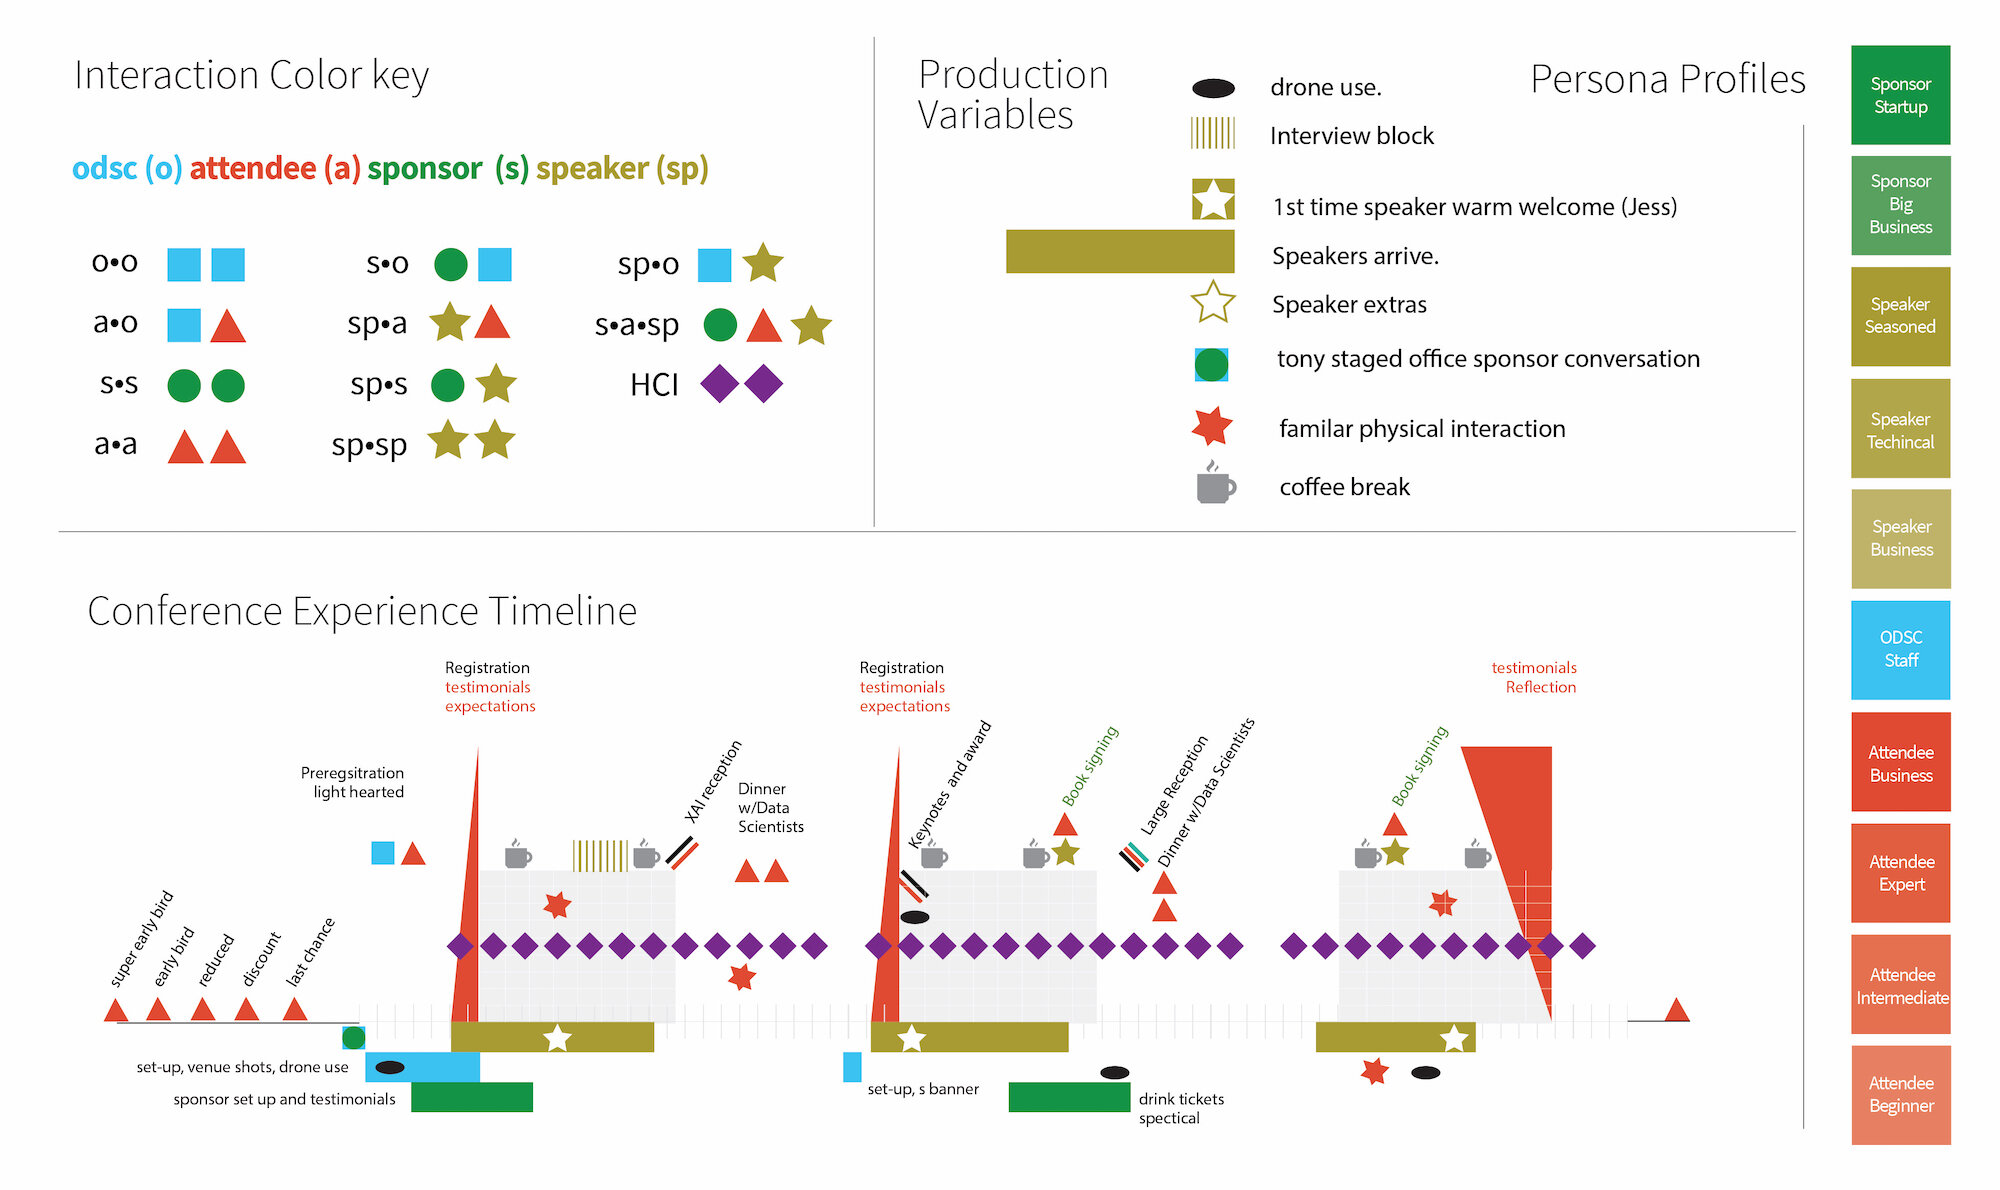
The sequence of headers shown hereafter map to blueprint CX. Click them to jump to that section and the back stage processes that may accompany them.
SALES, RESEARCH, PLAN, FIND YOUR WAY, ADMIRE, LEARN, MAKE FRIENDS

At the onset, a hypothesis journey helped reveal recruitment profiles and set personas in motion.
Brand Identity Transition
Emails and media campaigns
SALES
Before the on-site experience, to be attendees interact with ads.
Design decisions were influenced by a set of Design Principles—Inclusive, Clean, Accessible, Bright—that embodied ODSC’s smart, open and forward looking ideology, as well as by data pooled and analyzed by myself and the data science team.
Previous to the design principles, ODSC did not have brand guidelines. However, we did use a variety of blue shades throughout the brand, so I made sense of those design choices by first introducing a gradient background.
This 2018 video advertisement predated the Design Principles.
This 2019 advertisement concept developed in coordination with Warbird Creative. City sound data gradually becomes structured into an inspirational pattern.
Dark to Light to Contrast
Over time the overall web presence was lead to transition through making research from dark, to light, then to colorful contrast in accordance with these principles.
A masculine purple was chosen for our business-focused persona and a bright green often associated with innovation and sustainability for those focused on applied data science.
Web Experience
RESEARCH
After becoming aware of ODSC, users buy conference passes on ODSC.com and consume educational instructionals, created by the Data Science Team, on opendatascience.com.
Product Design and Design Research functions were built atop and channeled into instructional production cycles. The Data Scientists involved in this intrepreneurship lab, were led to create technologies, do analysis we could use and write about it.
Codeless solutions for odsc.com were constructed in high fidelity on a staging site with a drag and drop web-builder application. A record of odsc.com landing page as I designed it can be found at the link.

Collateral Examples


This is a walkthrough of opendatascience.com under development. This was an incremental rebuild of the whole site from the running state in March 2016. Designs were framed up on paper and through adobe products, then documented for a remote development team through annotated google development tool screenshots.
PLAN
To help manage their on-site experience to be attendees interact with planning artifacts — FAQs, and an app where they can chat with peers and select the workshops and talks they would like to attend.
On-Site Experience

internal experience documents
FIND YOUR WAY

Exhibitor Booth Pool


TV Schedule Sample
ADMIRE
The aspiration to become a speaker was realized in observation of speakers and user groups.
keynote S-banner backdrop and graphic

Podium Detail - laser cut logo fixed to wood

Podium Detail - networking graphic on white board cut to shape
LEARN
Between the London and California events we recruited 3 users for an in-depth interview and card sorting exercise, then, we supplemented those data with additional interviews — 5 dual-purpose SME interviews that were edited down for a podcast series and 20 short 5-10 minute interviews with 20 more attendees. Data scientist interviewers were paired with SMEs for interviews as part of a career development and design research skill building plan. In addition, we contracted photographer-designers to create photo-essay persona-journey artifacts of the conference experience. Synthesis was channeled through the design of archetypes, web pages, email and media campaigns, content and sales literature in post.

Archetypal Experience Dipdic #1

The number of stickers, what kind and what year they were given became a way to parse out frequent attenders of other conferences for intercept interviews.
MAKE FRIENDS

Archetypal Experience Dipdic #2
post talk networking drink voucher
Appendix
Sales Literature Example


Content Design Example - interviewer, Diego Arenas
Content Example - written by Diego Arenas, original here.
ODSC State of Data Science 2017 report: The Data Wave
 Reading this will provide a shallow-end understanding of
- Data Science roles
- Where the jobs are
- The going rate for Data Scientists
- The top 5 skills existing data scientists should learn and every new hire should have
view more
OVERVIEW
Data Scientists emerge from various backgrounds. Some hail from research fields like Biology, Chemistry and Physics while others rise from more quantitative backgrounds like Mathematics, Statistics and Economics, then there are those with Computer Science backgrounds, engineers… developers… journalists all stirring into the Data Scientist community. Some train themselves through experience, while others learn through academia. What they all have in common are two basic skills: a penchant for mathematics and above average analytical and critical thinking skills. During a great talk at ODSC Europe 2016 Neil Lawrence, Senior Principal Scientist at Amazon said, “There’s a sea of data, but most of it is undrinkable. So… who is a part of this desalination process?” This report expands on this metaphor in order to breakdown the field for those new to Data Science. Some may assumed that Data Scientists are to manage the entire wave of Big Data on their own, but this is not the case… growing are the careers, tools, and skills in the realm of data science. Companies do vaguely acknowledge this growth, and know that hiring in new capability will depend on their company’s needs, but understanding who to hire and why remains hugely preventative. Because some comp anies don’t know what they need, and because the separation between Data Scientist, Data Engineer and Data Analyst is not yet clear in the industry you can imagine the frustration of hiring managers and CxOs drowning below the learning curve. In this case we’d recommend connecting with one of our Data Science Associates for some direction or read on and start to understand some Data Science roles.
THE DATA ENGINEER
 Often, Data Engineers are good at optimizing the flow of existing computing technologies, the deployment and maintenance of big data platforms, and processing big data volumes; data engineers care for the architecture and infrastructure. Their concerns exist at the base of the data wave, where formation is more regular and expected, where efficiency and performance can be optimized, and where data architecture and analysis pipelines lie.
Data Engineers try to automate their work. Pretty much everything from – data integration, deploying new models created by data scientists, connecting new pieces of software to the architecture, to maintaining the installed platforms – can be scheduled.
Automation increases Data Engineers’ utility of time, which is why they can provide support to a number of Data Scientists each. Some companies report 1 Data Engineer per 5 to 10 Data Scientists, but it varies.
Often, Data Engineers are good at optimizing the flow of existing computing technologies, the deployment and maintenance of big data platforms, and processing big data volumes; data engineers care for the architecture and infrastructure. Their concerns exist at the base of the data wave, where formation is more regular and expected, where efficiency and performance can be optimized, and where data architecture and analysis pipelines lie.
Data Engineers try to automate their work. Pretty much everything from – data integration, deploying new models created by data scientists, connecting new pieces of software to the architecture, to maintaining the installed platforms – can be scheduled.
Automation increases Data Engineers’ utility of time, which is why they can provide support to a number of Data Scientists each. Some companies report 1 Data Engineer per 5 to 10 Data Scientists, but it varies.
THE BI DEVELOPER
 A BI, Business Intelligence, developer usually works with the enterprise data warehouse where data is highly structured, well defined… it’s categorized already.
The world of data science is an open one, however, BI developers work in a closed environment between operational systems and information systems. Their domains are Relational Databases, ODSs (Operational Data Stores) and DWHs (Data Warehouses.)
In Business Intelligence it is preferable to use the same tool across processes. For example, a single vendor will provide all the Database, ETL and visualization tools in one platform for BI problem solving, however in reality a BI Developer may end up with a collection of packaged tools meant to solve specific tasks. In data science, the diversity of programming languages and modeling tools grants competent data scientists the freedom and flexibility to include more robust processes into data pipelines. Business Intelligence teams have gained territory storing and providing information the company commonly uses, the quality they assure in their deliveries allows the Data Scientists to pick up their work and navigate it in deeper waters.
BI developers can do well with data integration processes, but that doesn’t mean they’ll be great mathematical modelers. When you hire a Data Scientist, be sure they know the fundamentals, it is important they know how to get results using a mathematical tool, and how to tune it or adjust it in order to best solve the problem at hand. Basically, they need to know the basics. “A fool with a tool, is still a fool” – Grady Booch, software designer
A BI, Business Intelligence, developer usually works with the enterprise data warehouse where data is highly structured, well defined… it’s categorized already.
The world of data science is an open one, however, BI developers work in a closed environment between operational systems and information systems. Their domains are Relational Databases, ODSs (Operational Data Stores) and DWHs (Data Warehouses.)
In Business Intelligence it is preferable to use the same tool across processes. For example, a single vendor will provide all the Database, ETL and visualization tools in one platform for BI problem solving, however in reality a BI Developer may end up with a collection of packaged tools meant to solve specific tasks. In data science, the diversity of programming languages and modeling tools grants competent data scientists the freedom and flexibility to include more robust processes into data pipelines. Business Intelligence teams have gained territory storing and providing information the company commonly uses, the quality they assure in their deliveries allows the Data Scientists to pick up their work and navigate it in deeper waters.
BI developers can do well with data integration processes, but that doesn’t mean they’ll be great mathematical modelers. When you hire a Data Scientist, be sure they know the fundamentals, it is important they know how to get results using a mathematical tool, and how to tune it or adjust it in order to best solve the problem at hand. Basically, they need to know the basics. “A fool with a tool, is still a fool” – Grady Booch, software designer
THE DATA ANALYST
 The Data Analysts may be scattered in various departments throughout a company, they provide data and information to the chiefs and managers of the department. They translate needed information into reports. They have advanced skills working with spreadsheets and often gain SQL knowledge along the way to query data for their analysis.
Data Analysts mostly work with structured data. They are heavy users of the Data Marts and Data Warehouses.
Data Analysts are not used to processing vast amounts of data and sometimes they struggle when the volume of data increases. In terms of professional development, they are likely to grow into more skillful data science and big data engineer positions, for which they are uniquely qualified given their depth of company insight.
The Data Analysts may be scattered in various departments throughout a company, they provide data and information to the chiefs and managers of the department. They translate needed information into reports. They have advanced skills working with spreadsheets and often gain SQL knowledge along the way to query data for their analysis.
Data Analysts mostly work with structured data. They are heavy users of the Data Marts and Data Warehouses.
Data Analysts are not used to processing vast amounts of data and sometimes they struggle when the volume of data increases. In terms of professional development, they are likely to grow into more skillful data science and big data engineer positions, for which they are uniquely qualified given their depth of company insight.
THE DATA SCIENTIST
 Those who operate in environments requiring seasoned discernment are Data Scientists. Data Scientists identify solutions in the crest of the wave, where problems are specific and messier. They’ll select or design the right algorithms to cull through the noise in order to reveal a solution, then elegantly communicate that solution through data visualizations and storytelling.
Data Science is about making Data Products. Data Products are tangible artifacts updated occasionally and systematically throughout their lifecycle. Data Scientists have the ability to build a data product to solve unique problems. The data product can be a machine learning model, an indicator, a score, an application, an API, you name it.
The value of a Data Scientist’s critical thinking process is that they can identify a business’ necessity, and spot the right question to solve. A Data Scientist understands a (business) problem, finds the right data (after surfing in tons of datasets), finds the right approach to the problem (after several trials), and creates, adjusts and deploys a data product. Summing and exploring new datasets, or creatively pulling new data out of thin air is all part of an expert Dsts process.
The expected skills of Data Scientist:
Mathematical modeling, Coding (in Python, R, Scala, Java, etc.), Relational Databases and SQL, Data Integration, Data Processing, NoSQL and unstructured data, Source Version Control, Platforms and frameworks, Analytical thinking, Critical thinking, Scientific method, Variable selection, Dimensionality reduction, Machine Learning, Statistics, Deep Learning, NLP (Natural Language Processing), Social Network Analysis, Creativity, Curiosity, Data Visualization, Storytelling, Data Interpretation, Teamwork, Ethical practices, Business alignment, Strategic, Agile project management. It is difficult to find someone with all the required or expected skills, that is why we call them Narwhals, (the real unicorns of the data ocean). Though the DS Narwhal exists, they are scarce, so companies tend to separate the roles, that is how the former roles entered the picture.
Those who operate in environments requiring seasoned discernment are Data Scientists. Data Scientists identify solutions in the crest of the wave, where problems are specific and messier. They’ll select or design the right algorithms to cull through the noise in order to reveal a solution, then elegantly communicate that solution through data visualizations and storytelling.
Data Science is about making Data Products. Data Products are tangible artifacts updated occasionally and systematically throughout their lifecycle. Data Scientists have the ability to build a data product to solve unique problems. The data product can be a machine learning model, an indicator, a score, an application, an API, you name it.
The value of a Data Scientist’s critical thinking process is that they can identify a business’ necessity, and spot the right question to solve. A Data Scientist understands a (business) problem, finds the right data (after surfing in tons of datasets), finds the right approach to the problem (after several trials), and creates, adjusts and deploys a data product. Summing and exploring new datasets, or creatively pulling new data out of thin air is all part of an expert Dsts process.
The expected skills of Data Scientist:
Mathematical modeling, Coding (in Python, R, Scala, Java, etc.), Relational Databases and SQL, Data Integration, Data Processing, NoSQL and unstructured data, Source Version Control, Platforms and frameworks, Analytical thinking, Critical thinking, Scientific method, Variable selection, Dimensionality reduction, Machine Learning, Statistics, Deep Learning, NLP (Natural Language Processing), Social Network Analysis, Creativity, Curiosity, Data Visualization, Storytelling, Data Interpretation, Teamwork, Ethical practices, Business alignment, Strategic, Agile project management. It is difficult to find someone with all the required or expected skills, that is why we call them Narwhals, (the real unicorns of the data ocean). Though the DS Narwhal exists, they are scarce, so companies tend to separate the roles, that is how the former roles entered the picture.
 There is high demand for these Narwhal solutions, but they may not be the answer to your need. Many companies just lack the fundamental infrastructure and workflows. This reality motivates more and more academics to migrate from their labs to the business world, learning fast the ways of business and proving their value. New university programs and workshops on Data Science as applied to business keep cropping up to fill in the gap of knowledge expected of new Data Scientists. With new applications and methodologies spurring innovation across the industry it’s reasonable to assume that the stream of data inclined will continue flooding workshops and programs all over the globe. Davenport and Patil’s article posited that Data Scientists would be inquisitive visionaries translating data and information to insight without writing code, and the profession certainly draws the type, but for now the basics remain the basics. The combination of hands on technical and business trainings geared toward developing an adept industry acumen remain critical.
see the rest
THE DATA SCIENCE TEAM
 Data Science Teams can raise the tide for everyone if there is a culture of collaboration. If people in different areas of a company are encouraged to solve problems together rather than working insulated from one another, as is common with analysts, projects will be more successful. With more successful projects the chances of getting further executive support for new data products will go up, and vice versa; executives granting DS teams the access they need to operate collaboratively will be more successful.
DS initiatives should first focus on existing company problems and how new technology can immediately benefit everyone, then they should focus on improving results and optimizing processes, reducing costs or adding value to the company’s customers, and in parallel strategically prepare the team to tackle future endeavors.
Data scientists can each work on multiple projects, some of which may be unrelated apart from the application of a specific machine learning technique, visualization, etc. I spoke with Jonathan Schwartz from Google Deepmind London about a month ago, he offers some great insight into Data Science Teams during our interview, so if you care to lend him your ear for 30minutes, here’s the podcast.
Data Science Teams can raise the tide for everyone if there is a culture of collaboration. If people in different areas of a company are encouraged to solve problems together rather than working insulated from one another, as is common with analysts, projects will be more successful. With more successful projects the chances of getting further executive support for new data products will go up, and vice versa; executives granting DS teams the access they need to operate collaboratively will be more successful.
DS initiatives should first focus on existing company problems and how new technology can immediately benefit everyone, then they should focus on improving results and optimizing processes, reducing costs or adding value to the company’s customers, and in parallel strategically prepare the team to tackle future endeavors.
Data scientists can each work on multiple projects, some of which may be unrelated apart from the application of a specific machine learning technique, visualization, etc. I spoke with Jonathan Schwartz from Google Deepmind London about a month ago, he offers some great insight into Data Science Teams during our interview, so if you care to lend him your ear for 30minutes, here’s the podcast.
YOUR COMPANY
 I’m sure, you, like many companies, acknowledge the need for a data professional in some regard, and that those responsibilities vary from company to company. These specific needs will guide companies to certain hiring distinctions. However, as previously stated, because the separation between Data Scientist, Data Engineer, Analyst and others are more fluid, the barrier for hiring managers and CxOs is quite a high. So, hopefully the above information gave you the insight you need to begin a data driven conversation.
Taking the initiative means informing yourself, or else you may find yourself paying high consultancy costs. There’s no sense in shelling out for experienced practitioners whose skills sets surpass your needs. As an alternative, you may prepare by incrementally training existing staff on new skills, or by hiring in new talent. Once a company starts riding the results possible through Data Science, it triggers a concrete role separation and a shift to more solid data driven strategies.
I’m sure, you, like many companies, acknowledge the need for a data professional in some regard, and that those responsibilities vary from company to company. These specific needs will guide companies to certain hiring distinctions. However, as previously stated, because the separation between Data Scientist, Data Engineer, Analyst and others are more fluid, the barrier for hiring managers and CxOs is quite a high. So, hopefully the above information gave you the insight you need to begin a data driven conversation.
Taking the initiative means informing yourself, or else you may find yourself paying high consultancy costs. There’s no sense in shelling out for experienced practitioners whose skills sets surpass your needs. As an alternative, you may prepare by incrementally training existing staff on new skills, or by hiring in new talent. Once a company starts riding the results possible through Data Science, it triggers a concrete role separation and a shift to more solid data driven strategies.
Companies interested in leveraging Data Science internally commonly start by redefining an existing data related role and start small. Employers define business goals for their data enabled employees, and grant them freedom to choose the analytical approaches to help them solve, like a programming language or a specific data analytics platform, but we’ll get into common tools and platforms later.
Assuming that companies using data science and their successes will incite others to ride the data wave, the job market will ache for data literacy. Just glancing at the number of data competitions, education programs and opportunities across industries, it seems it already is. Companies are literally stockpiling raw data in preparation for the oncoming storm, data is the new oil.
DATA SUPPORT SYSTEMS
 Beside the boardroom’s vacuum for data driven strategies, cloud services and data support systems do work to make such strategies more accessible. The data fever does not only directly affect the data scientist and companies, but also spreads to the ecosystem of big data and machine learning tools. Vendors, providers, and tech companies like Docker and Digital Ocean encourage quickness and development of the data science environment across industries.
Yes, exploring this monsoon of information and making sense of it in a timely fashion will require data professionals, but also, it requires big data processing platforms. Companies using these services speed up developments as they try out new platforms. Companies developing these platforms benefit by open sourcing their cutting edge technologies and allowing data scientists to fulfill their curiosity. Virtual machines and contemporary container technologies allow for rapid prototyping and testing of new approaches, platforms, and architectures. The DevOps world is closer to Data Science than we might think, that is why nowadays we are starting to talk about DataOps.
New commercial platforms and frameworks are required to solve increasingly unique big data problems, so the cycle starts:
Data startups pour out their hearts, venture capitalists pounce, capitalism and UX select, and these new platforms and technologies get taught in Universities educating new data scientists, and the cycle starts again.
In these 5 short years since 2012, when Davenport and Patil pointed out the lack of educational programs, now, Data Science programs flourish in top ranked universities all over the world. Schools of Mathematics rebranded their regular programs to Data Science degrees and opened the scope of their core courses, then Informatics and Computer Science schools joined the wave. But, the gap between private companies and capable professionals is still apparent, this is an opportunity for data companies offering data science bootcamps for 8 weeks or 3 months, teaching machine learning, data visualization and storytelling to the trainees. These kinds of trainings ensure smooth transitions for academics set to leap into the business world on a sprint.
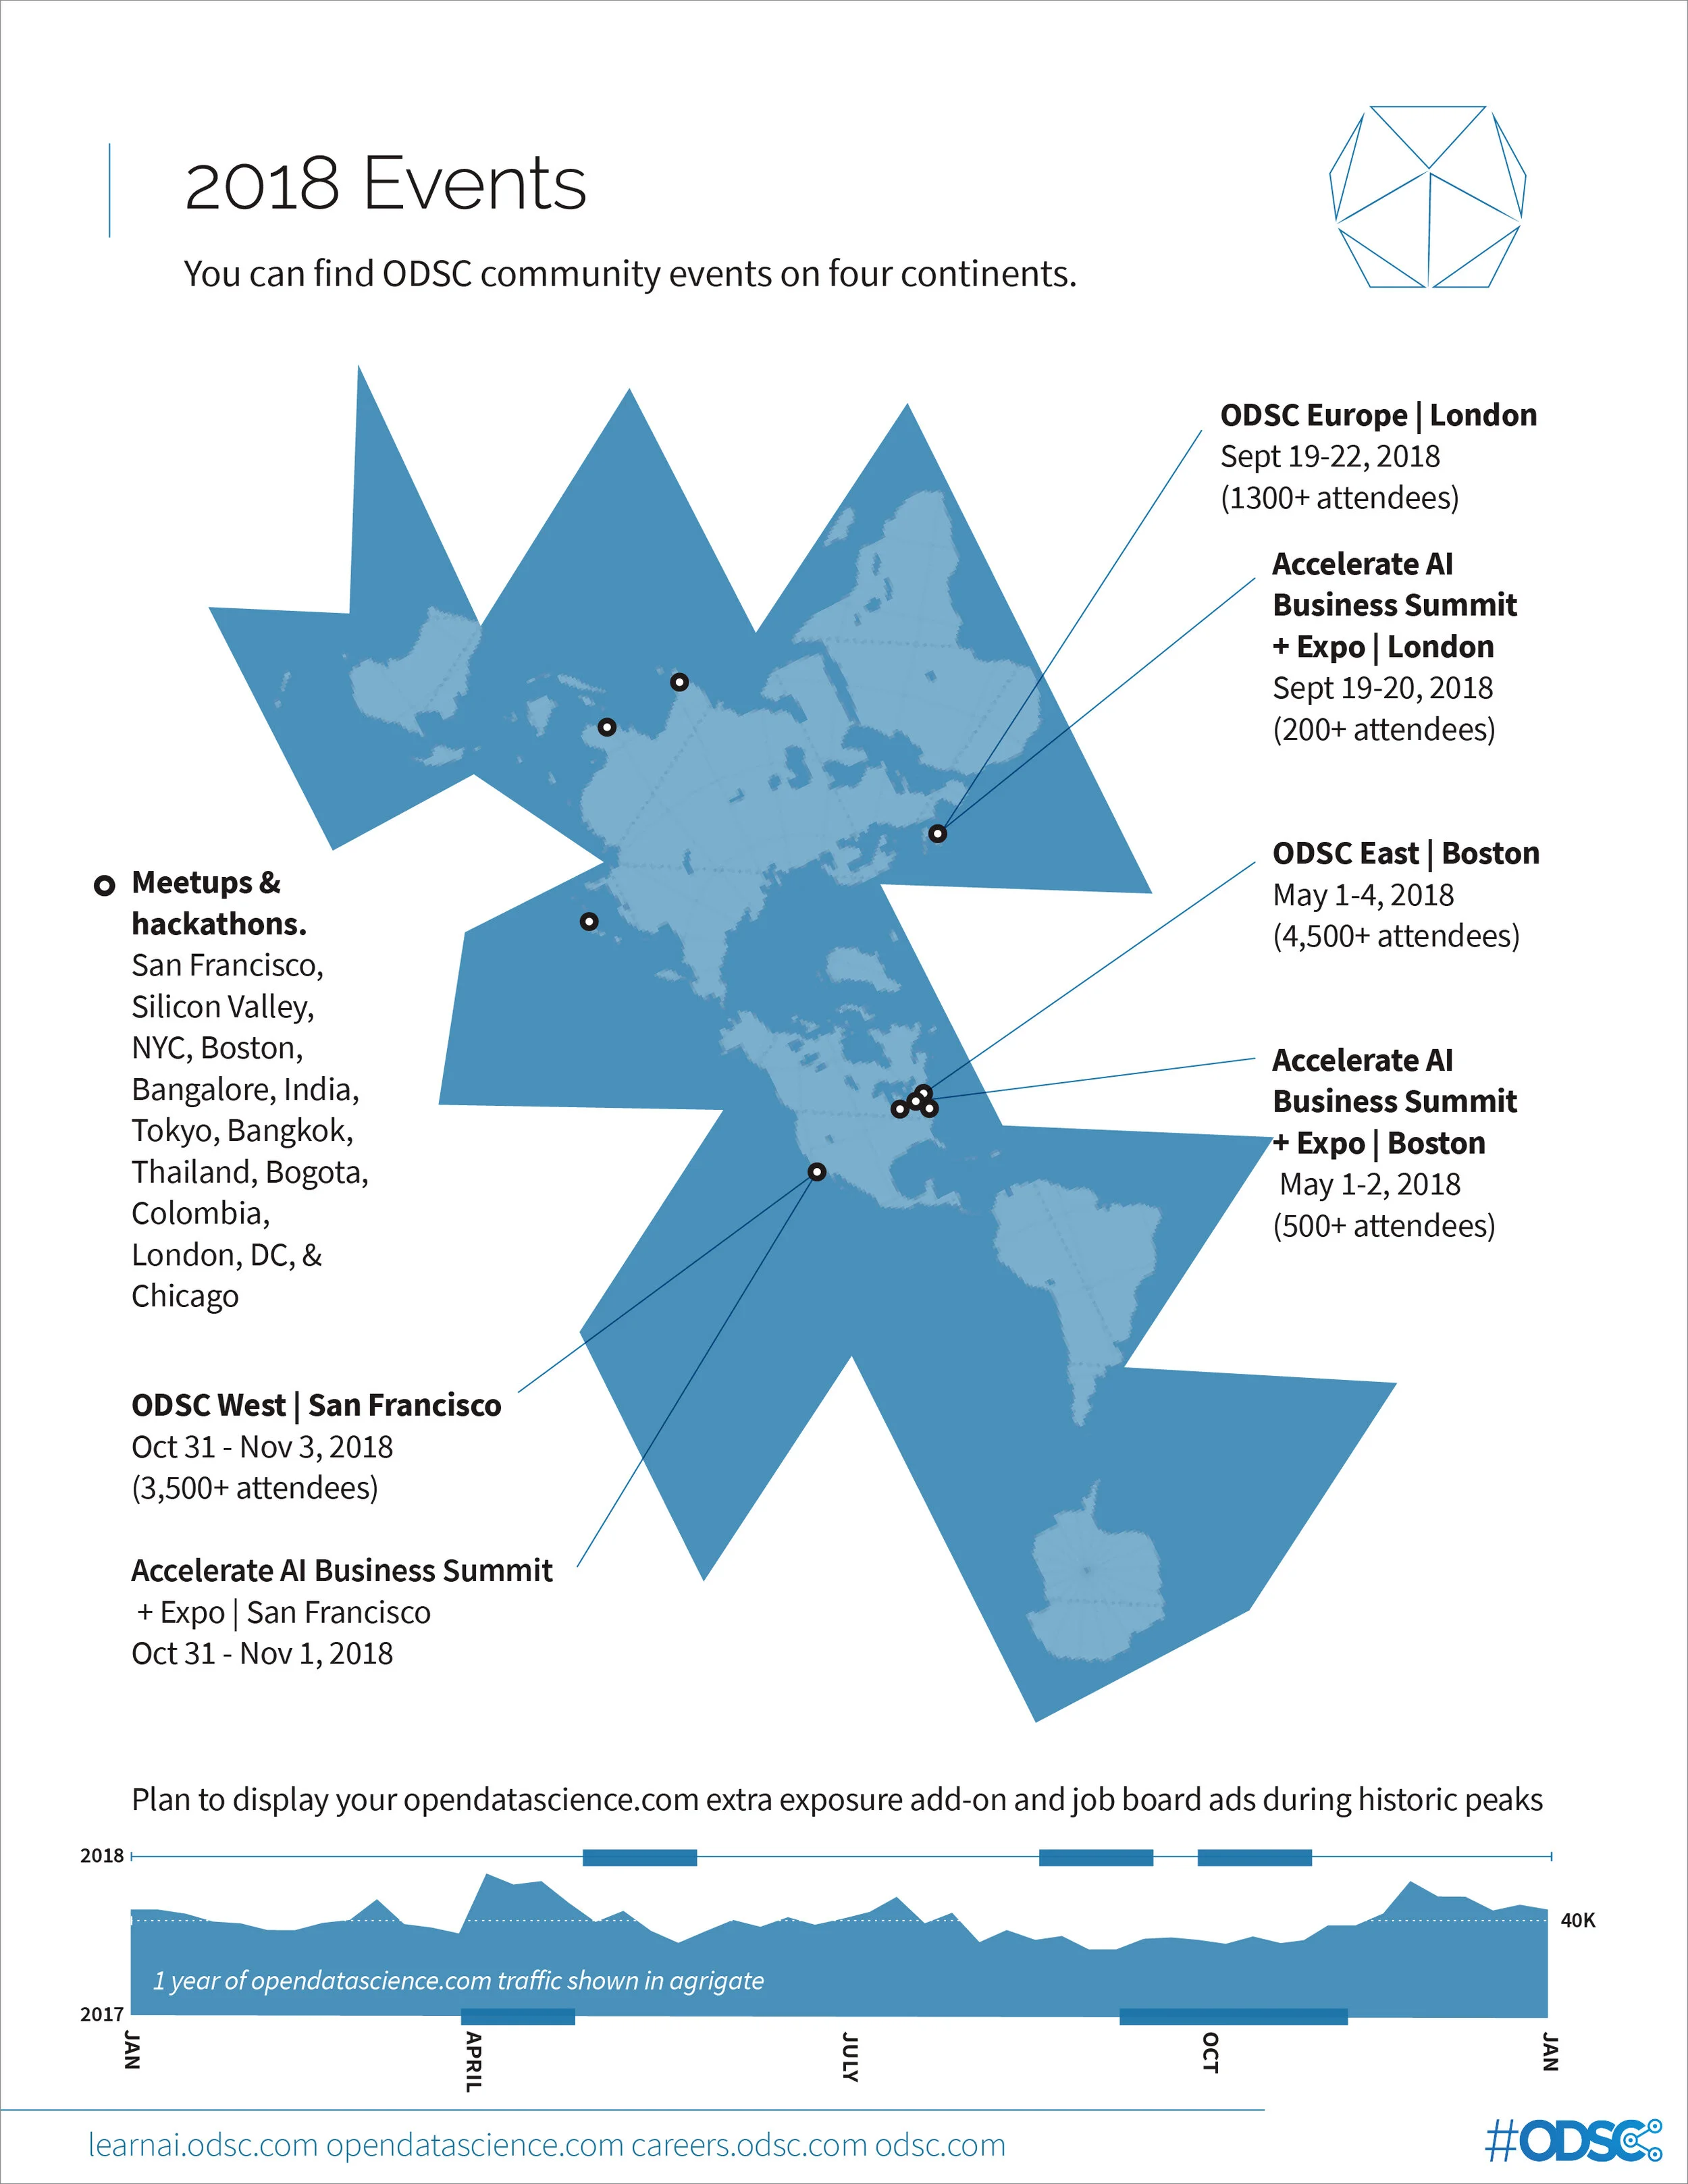
Community engagement across the board often through conferences fuels the core of data science development. ODSC Conferences provide the unique opportunity to see what leaders and early adopters are doing, developing, and thinking in the data science field; it a place to interact with alike people in data science, exchange thoughts, get informed, form companies, and poach. And, meetups offer a narrower version of the same.
Beside the boardroom’s vacuum for data driven strategies, cloud services and data support systems do work to make such strategies more accessible. The data fever does not only directly affect the data scientist and companies, but also spreads to the ecosystem of big data and machine learning tools. Vendors, providers, and tech companies like Docker and Digital Ocean encourage quickness and development of the data science environment across industries.
Yes, exploring this monsoon of information and making sense of it in a timely fashion will require data professionals, but also, it requires big data processing platforms. Companies using these services speed up developments as they try out new platforms. Companies developing these platforms benefit by open sourcing their cutting edge technologies and allowing data scientists to fulfill their curiosity. Virtual machines and contemporary container technologies allow for rapid prototyping and testing of new approaches, platforms, and architectures. The DevOps world is closer to Data Science than we might think, that is why nowadays we are starting to talk about DataOps.
New commercial platforms and frameworks are required to solve increasingly unique big data problems, so the cycle starts:
Data startups pour out their hearts, venture capitalists pounce, capitalism and UX select, and these new platforms and technologies get taught in Universities educating new data scientists, and the cycle starts again.
In these 5 short years since 2012, when Davenport and Patil pointed out the lack of educational programs, now, Data Science programs flourish in top ranked universities all over the world. Schools of Mathematics rebranded their regular programs to Data Science degrees and opened the scope of their core courses, then Informatics and Computer Science schools joined the wave. But, the gap between private companies and capable professionals is still apparent, this is an opportunity for data companies offering data science bootcamps for 8 weeks or 3 months, teaching machine learning, data visualization and storytelling to the trainees. These kinds of trainings ensure smooth transitions for academics set to leap into the business world on a sprint.
Community engagement across the board often through conferences fuels the core of data science development. ODSC Conferences provide the unique opportunity to see what leaders and early adopters are doing, developing, and thinking in the data science field; it a place to interact with alike people in data science, exchange thoughts, get informed, form companies, and poach. And, meetups offer a narrower version of the same.
ANALYSIS
Data Scientist Salaries in the US Cities
We crawled the website Indeed.com for job offers in the US cities and compared this year’s report to last years jupyter notebook written by Jason O’Rawe former ODSC Data Science Associate. It’s clear that most of the US jobs are still in the cities with heavy tech industries, so getting a Data Scientist seasoned or green to a job outside the hot spots might take a perky offer. See map belowThe average salary offered on Indeed.com for a “data scientist” job is 86.000USD. Average salary from state to state is consistent. For example, the average salary for a Data Scientist in the state of New York is only 4.000USD below the national average. The states with the most data scientist offers are California, New York, Massachusetts, Virginia and New Jersey.
The cities that have the most number of job postings, New York City and San Francisco, show average salaries over 125.000USD. Then, Seattle, Chicago, Boston and San José follow with an average salary over 115.000USD. The minimum average salary in any US city with more than 30 jobs posted on Indeed is ~80.000USD. It appears the US Data Science market is bull at least for aspiring data scientists.
The city with the highest average salary and with more than 30 job offers is New York City with an average of 126.000USD.

Data Science Skills
The most frequent data science skill in the posts analyzed is the fluency in the programming language Python. Its flexibility and multi-purpose scope helps data scientists clean data as well as building machine learning models and data visualizations. Tools like the Jupyter Project help to develop analysis in a lean and interactive way. The variety of libraries available is robust and the community behind Python makes it a baseline language.The R language is the second demanded skill required of data science positions in the US. Like Python, R also benefits from a community supporting its libraries.
R and Python may be the top two skills because users can test both locally on their personal machines, making them an accessible learning platform. Both languages have extensive libraries to support data analysis and modeling tasks. The development of frameworks with GUIs makes it even easier for new learners to jump in and swim with big players. We don’t see these two languages fading away in the near future, so put them on your job postings.
Number 3, ML, as a general term, is a key part in data science. Most of the data products will be a predictive model or the implementation of algorithms to understand the data, that’s why is mentioned in more than 50% of the job offers.
Fourth on the list, the SQL language is required to deal with queries to databases and form extractions or reports. SQL is an important part of extraction and modeling processes in a data science pipeline. If a data product is required as a final outcome, as some of the applications will be database oriented, SQL will be used to model and transmit the data to the persistent layer of a that data product.

Big Data skills are also required from data scientists, but expert proficiency in tools and frameworks seen throughout the chart like Hadoop and Spark, or Hive, Pig and HBase appear in a low percentage of posts meaning these competencies are required on a case by case basis. That being the current case, we expect to see growth for this spray of tools triggered by the increased access to IaaS (Infrastructure as a service), PaaS (Platform as a service) and cloud solutions making deployments feasible for companies with data science ambitions. New container technologies will yield new strategies on the use of big data platforms, and giving developers access will increase the user base and with it demand for these skills. The learning curve for data professionals is flattening with broad access to personal accounts in the cloud and to MOOCs. We are not sure the field will bow the way of eliminating coding as Patil and Davenport originally suggested, though drag and drop tools are trending fore filling their prediction, none the less Data Science is becoming more accessible, and on that point we are extremely proud.
Data Science Tools
If we parse the above skills by city and select for the top 5 cities according to number of job offers, we can see that positions in Boston and Chicago call for narrower skills sets; and in New York City, Seattle and San Francisco companies look for data scientists with a broader range of skills.On the graph below the tools are listed on the (x-axis) per city according to the key in the upper right. The number of times a skill appears in all the descriptions is noted as a percentage on the y-axis. Notice Chicago’s high percentage of job offers that include Python skills.

There is a trend toward a broad spectrum of data science tools over a dedicated focus. Compared with the previous year, the percentages are lower indicating that there may be a growing number of keywords in data science job specifications outside our search expectations.
As an aside, it is worth mentioning that Scala (number 7 on the list above) and Spark (number 8) skills were the top paid tech jobs in 2016, according to the stackoverflow’s Developers Survey 2016. Both programming language skills averaging $125,000.- In the same Developers Survey in 2017, Scala developers have the highest salaries with $110.000.- on average in the US.
Note: In later blogs and next years report we will broaden our scope to address the larger DS,